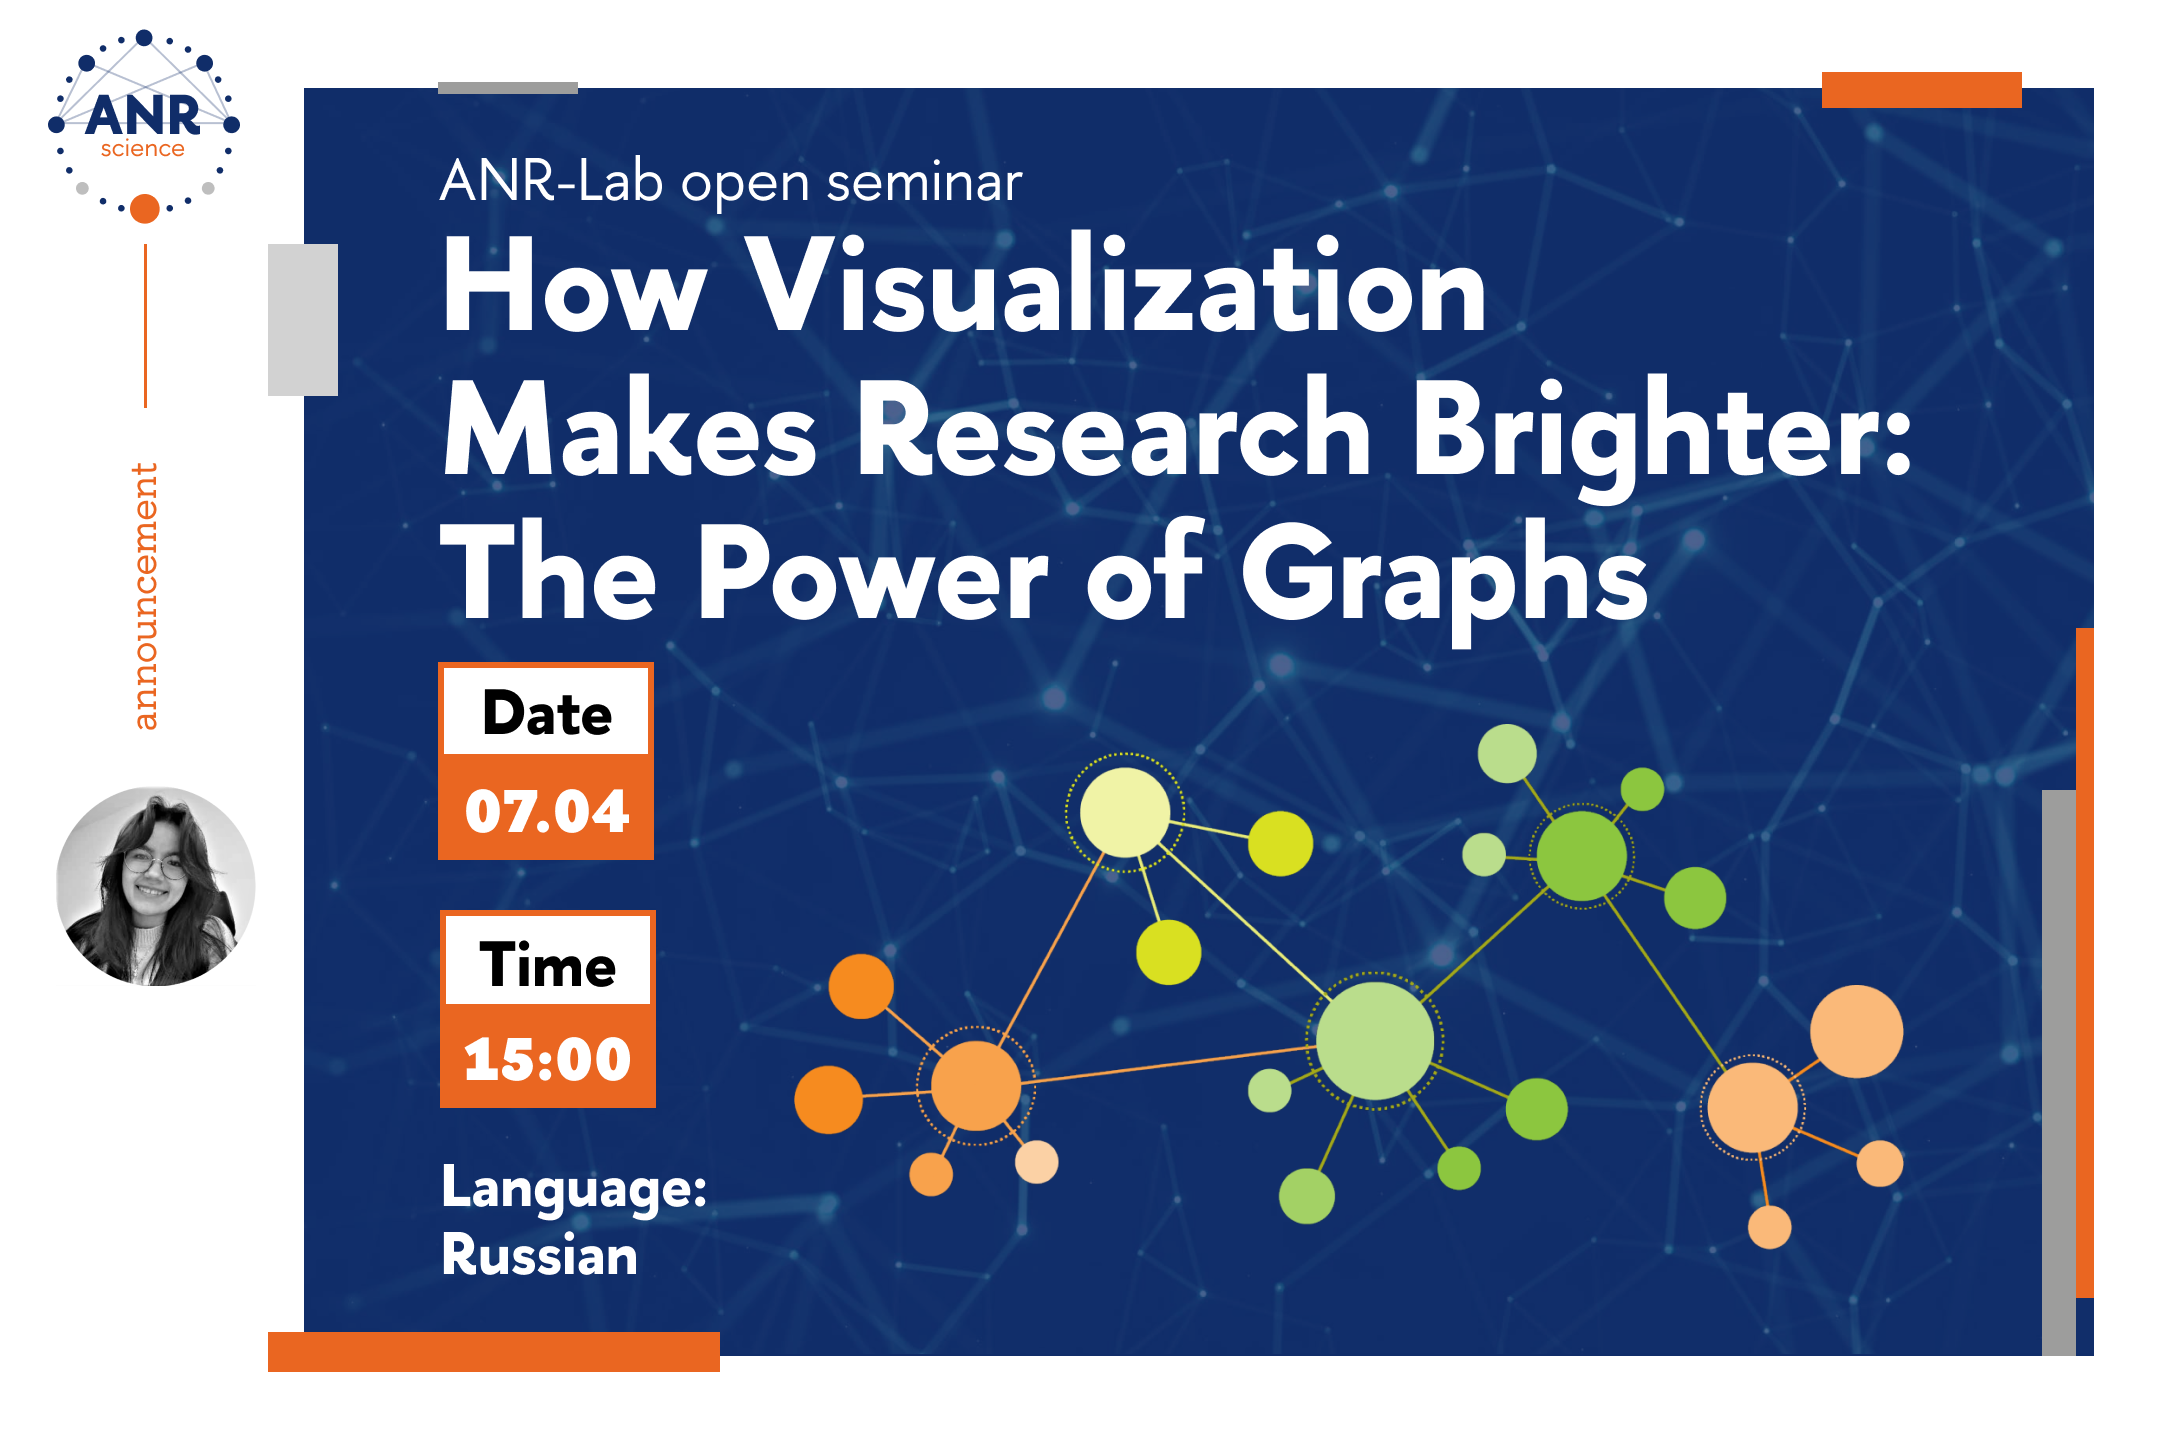
ANR-Lab Open Seminar "The Power of Graphs: How Visualization Makes Research Brighter"
Event ended
On April 7 at 15:00, laboratory research intern Daria Osokina will talk about tools for data visualization in research.

In this seminar, you will learn how to turn numbers and tables into graphs that will grab attention and convey the value of your research. We will walk through the process of creating visualizations step by step, introduce the capabilities of popular Python packages such as Matplotlib, Seaborn, Plotly, and Bokeh, and select the best tools for different tasks. You will also learn the key principles of effective visualization so that your graphs are not only aesthetically pleasing but also understandable to your audience. Using examples, we will discuss how to improve the presentation of data and share resources for further development in this area.
This seminar will be useful for researchers who are just starting to work with code and those who want to improve their visualization skills.
Seminar language: Russian.
Please register via the link.
ATTENTION! The seminar has been rescheduled for 15:00 on April 7.
Date
7 April
15:00
Address
Zoom
